quality
How is the portfolio of schools meeting students' academic needs?
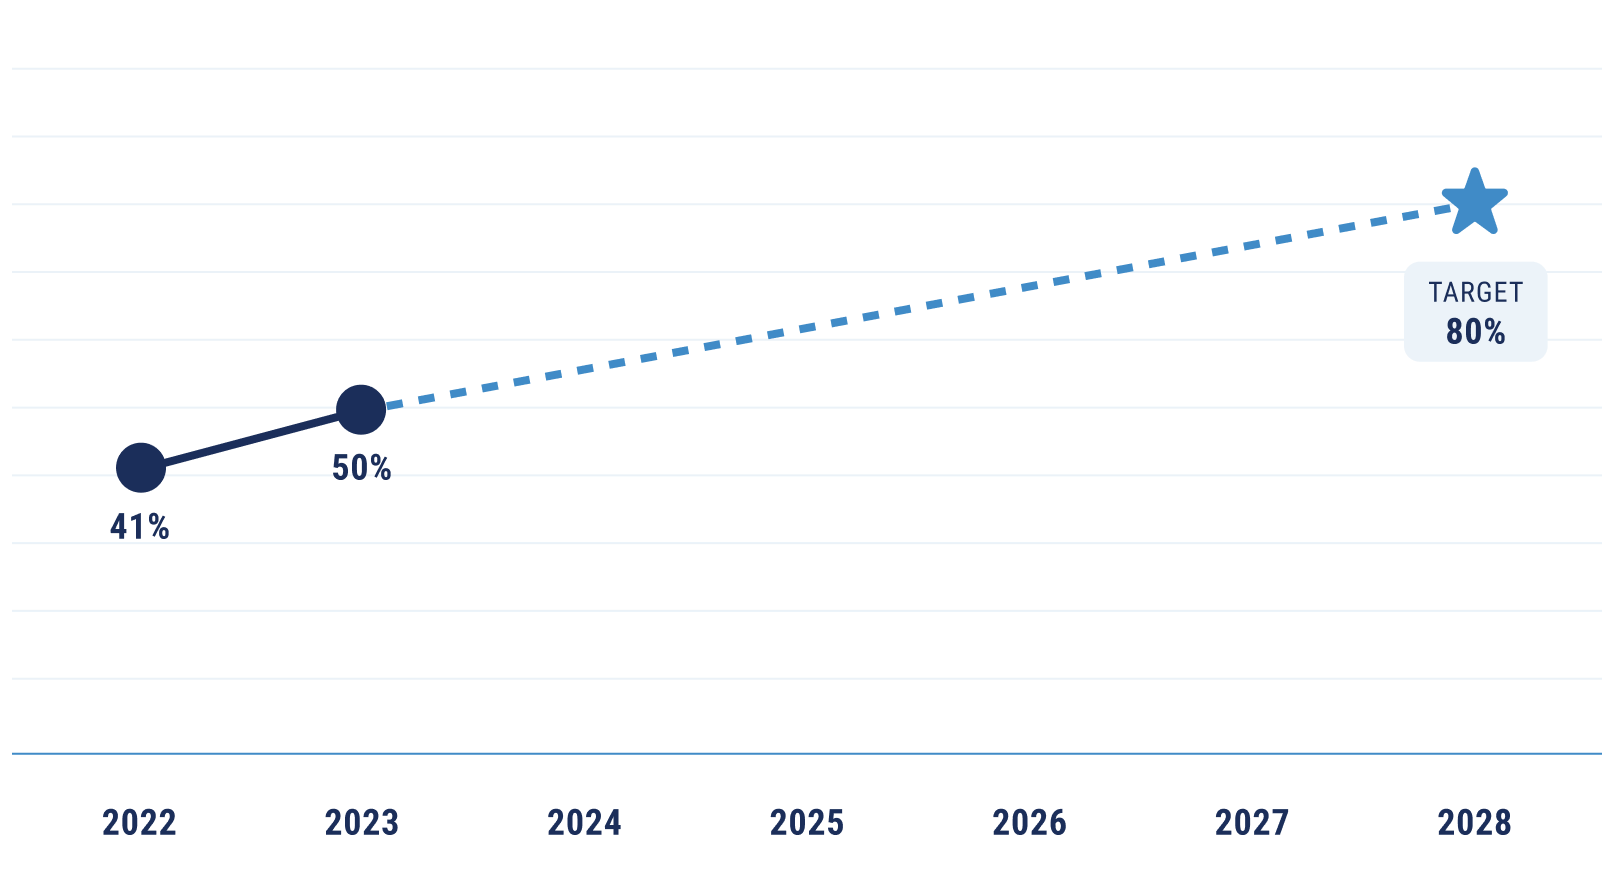
Percentage of students attending an A or B-rated school (SPRI)
The School Performance Renewal Index (SPRI) is a metric calculated by NOLA-PS for use in renewal decisions. In addition to SPRI, financial stability and organizational performance play pivotal roles in the renewal process.
For more information about how the SPRI is calculated, please see the Charter School Accountability Framework published by NOLA-PS.