New Orleans’ Schools Before Hurricane Katrina
The New Orleans public school system is facing many challenges:
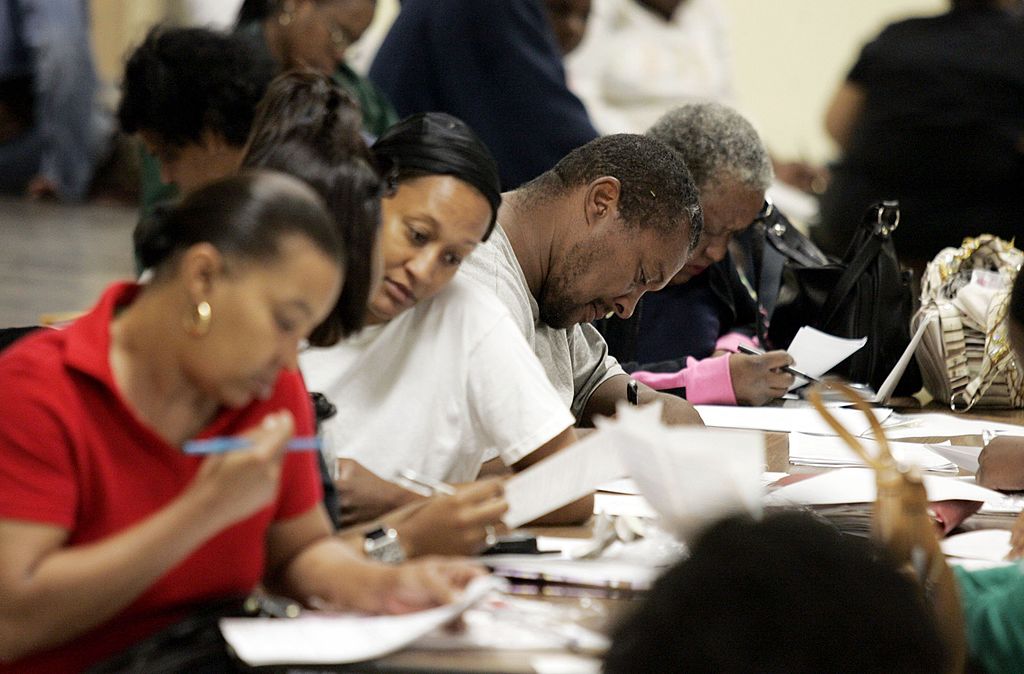
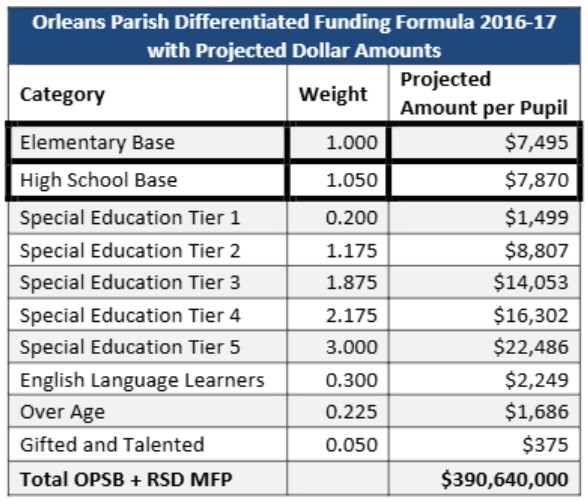
- Budget Deficits: The Orleans Parish School Board has budget deficits, federal investigations, and management issues; the district is effectively bankrupt.
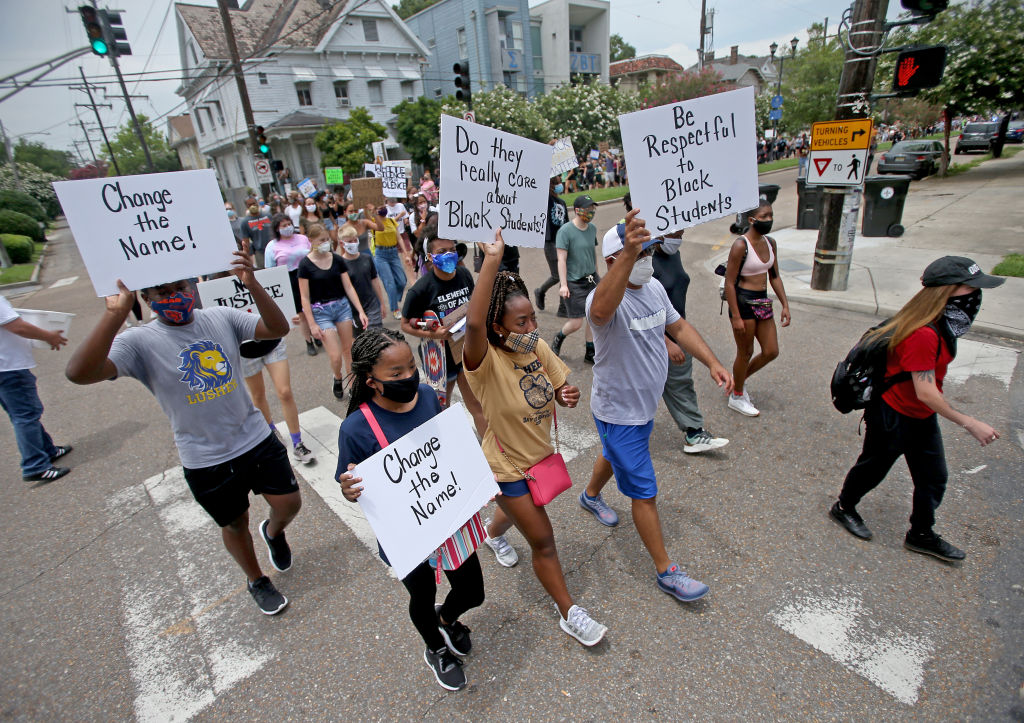
- Local Violence and Poverty: Many students citywide are experiencing poverty and the city faces devastating rates of violence.
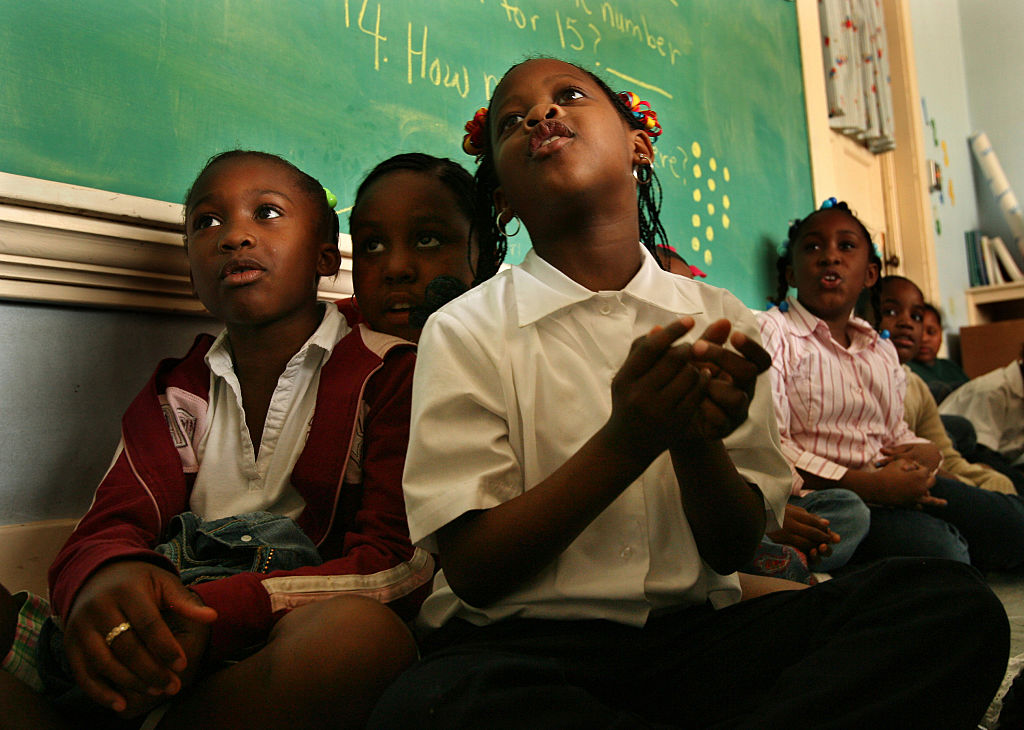
- Low Academic Performance: New Orleans is ranked as the second-lowest performing school district in Louisiana, which is the second-lowest ranked state nationwide. The majority of New Orleans Public School students attend schools labeled “failing” by the state.
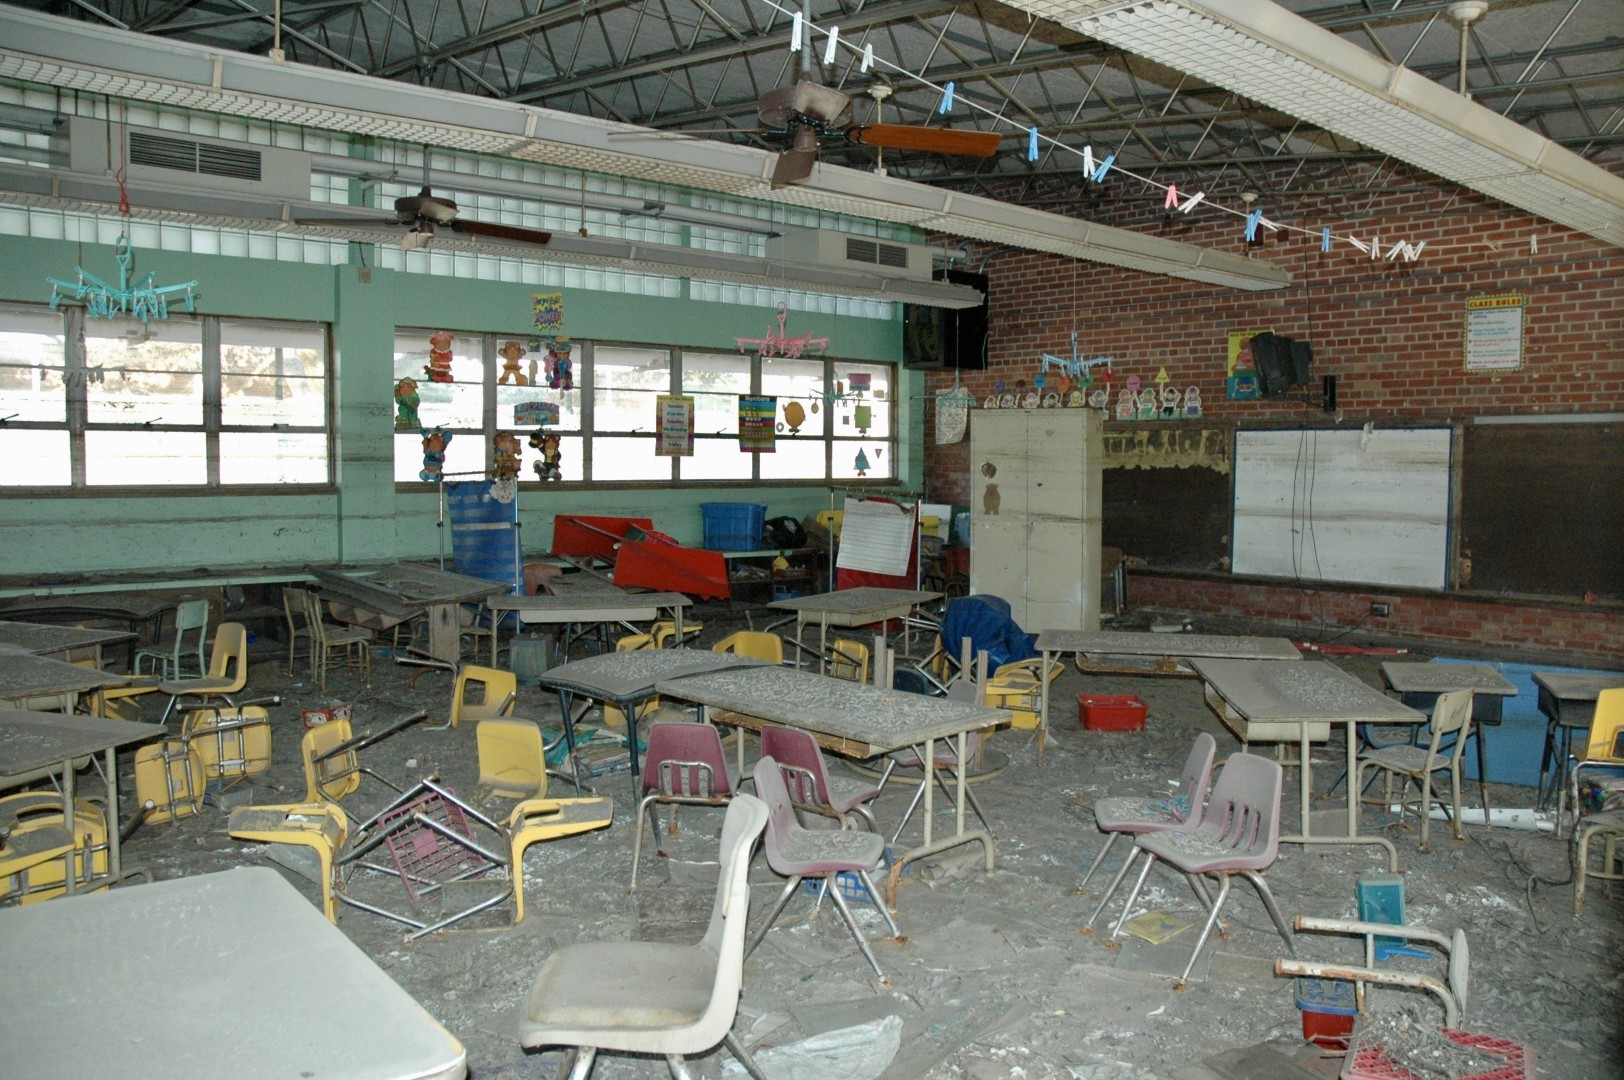
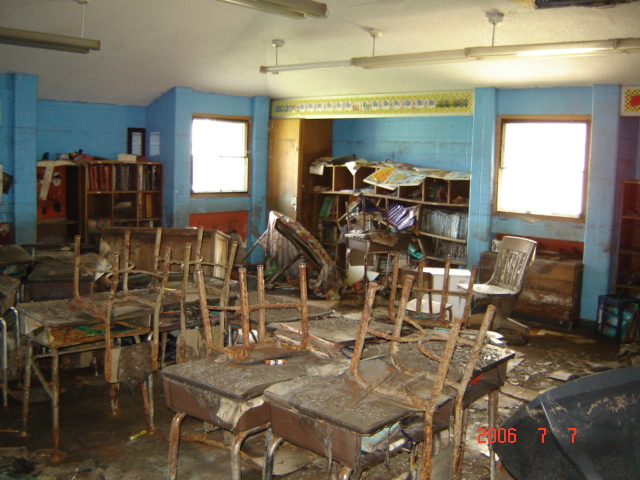
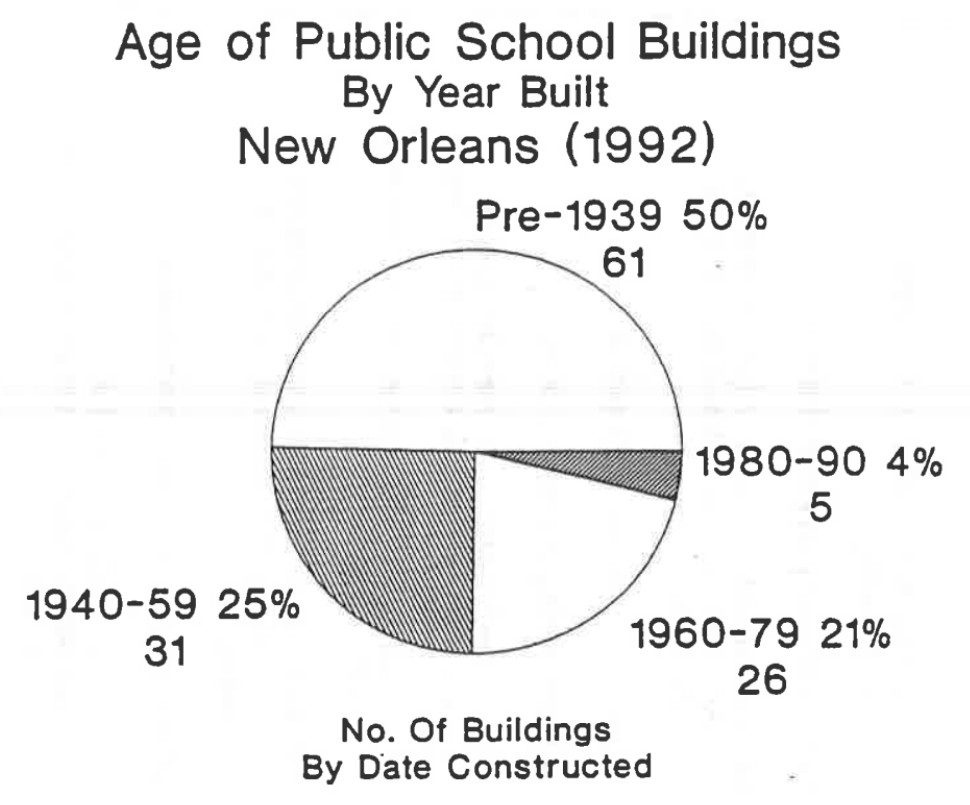
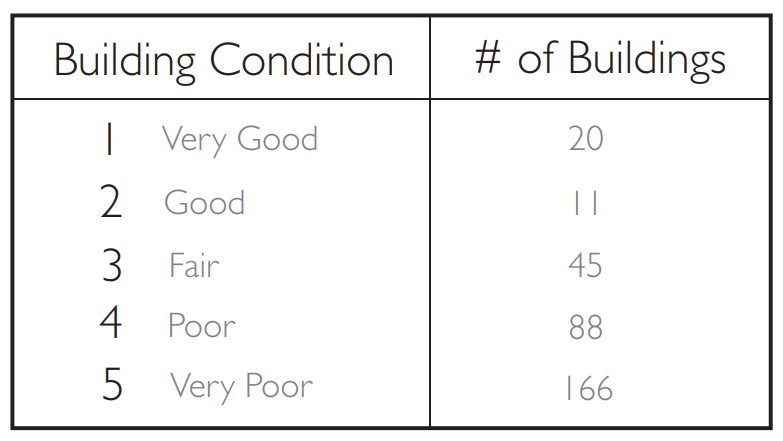
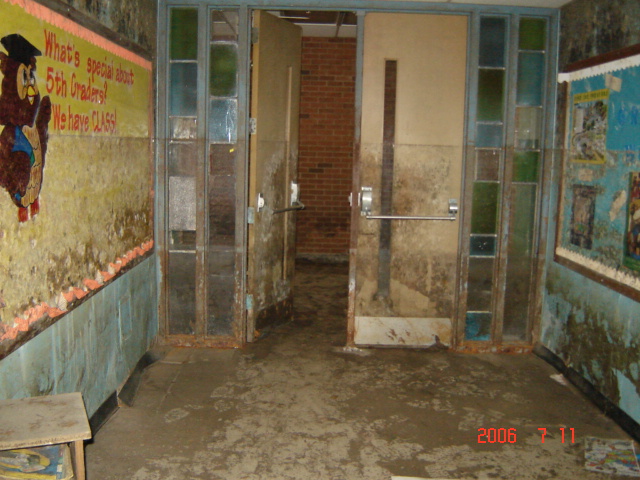
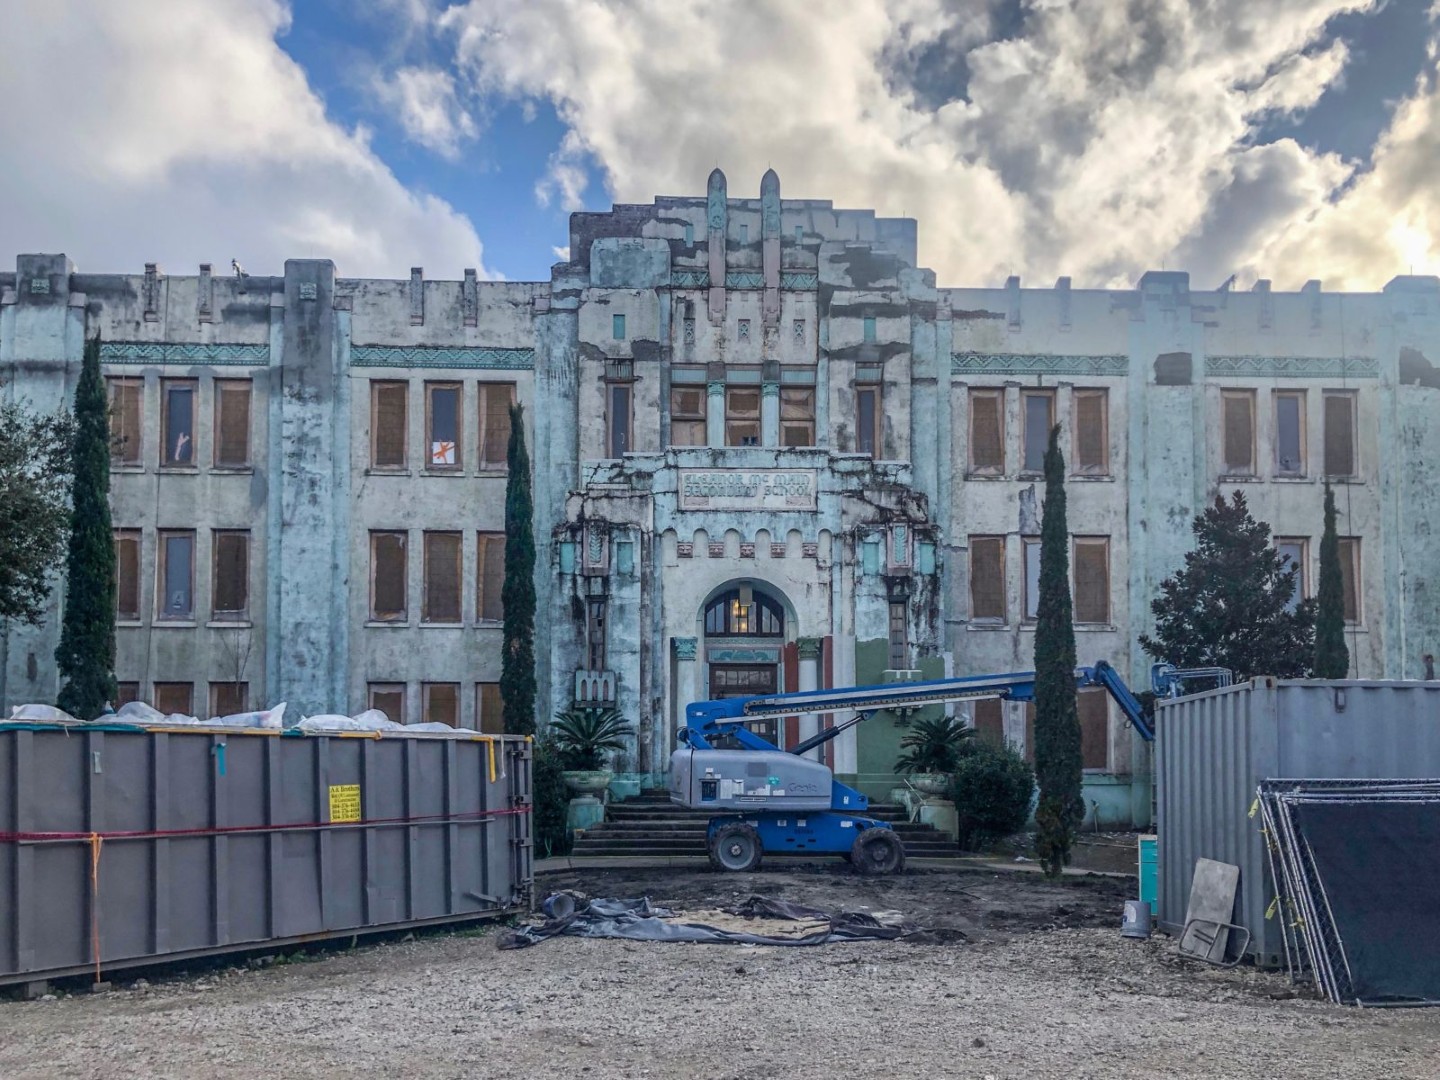
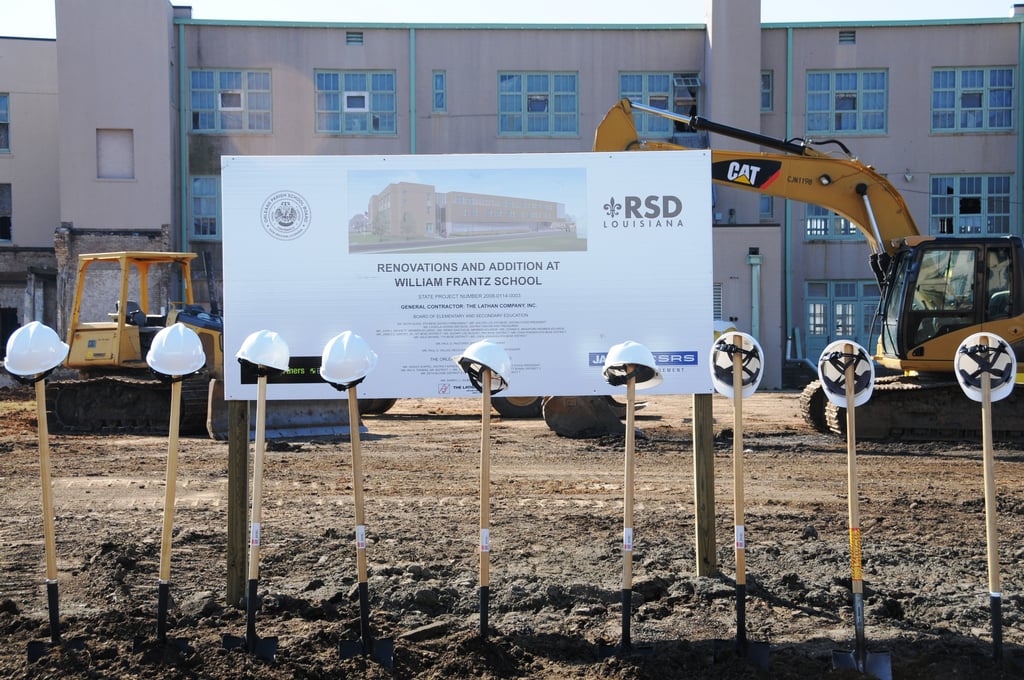
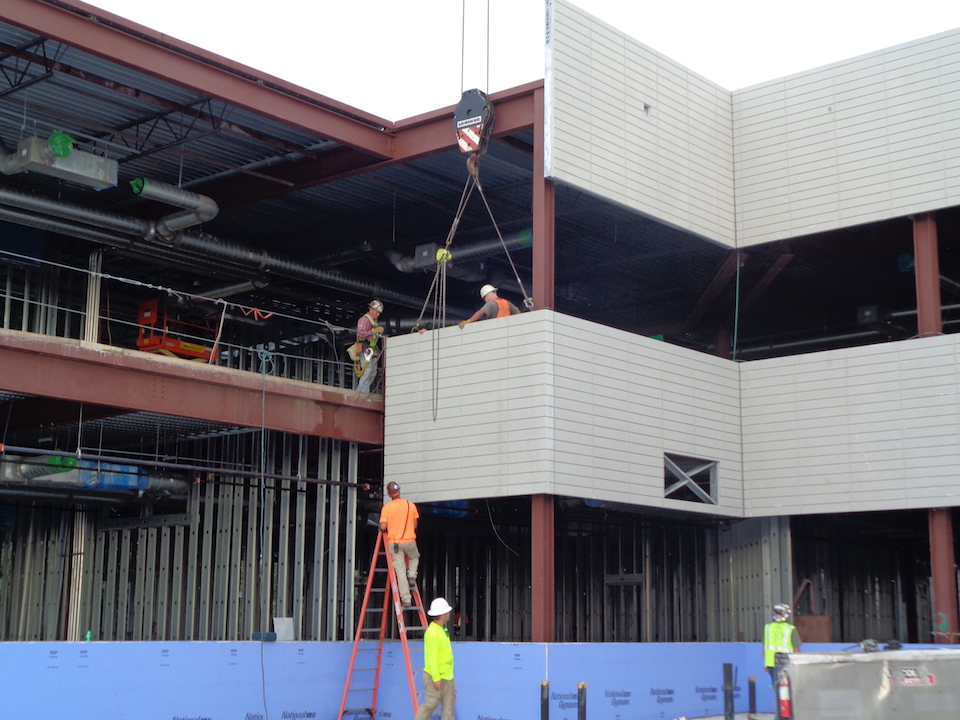
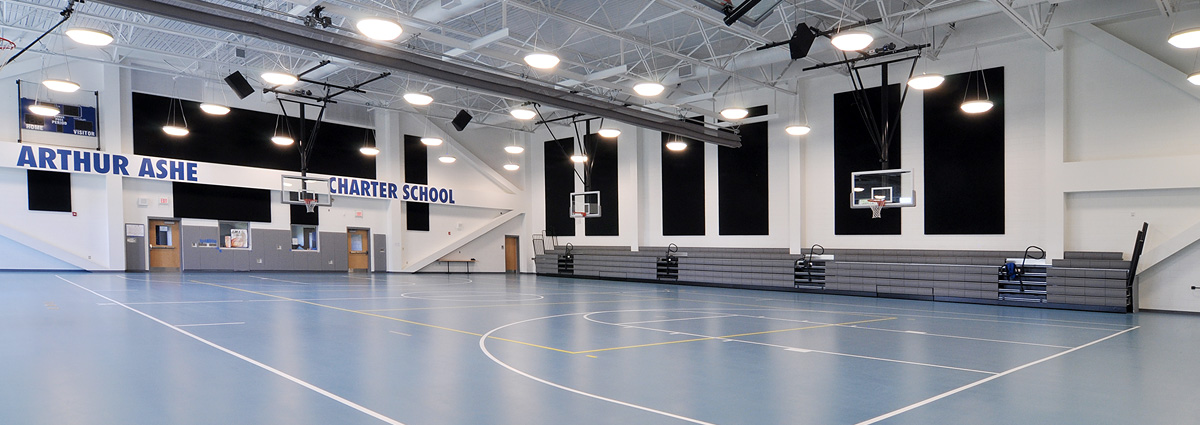
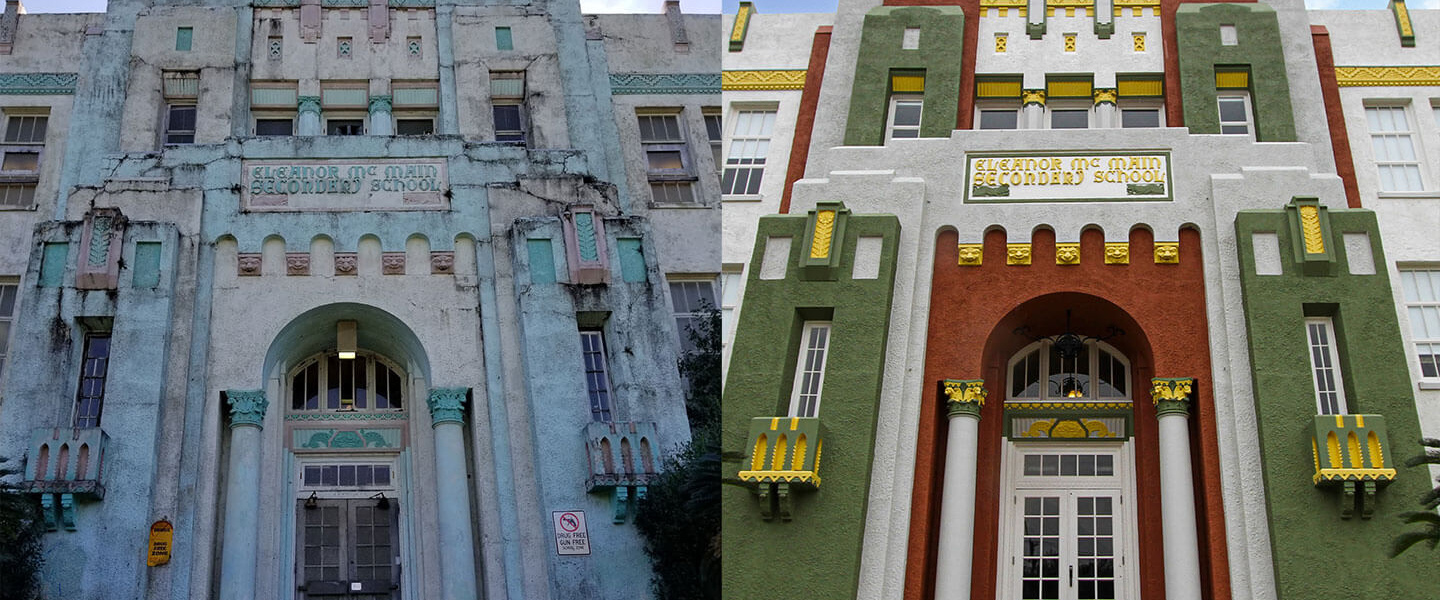
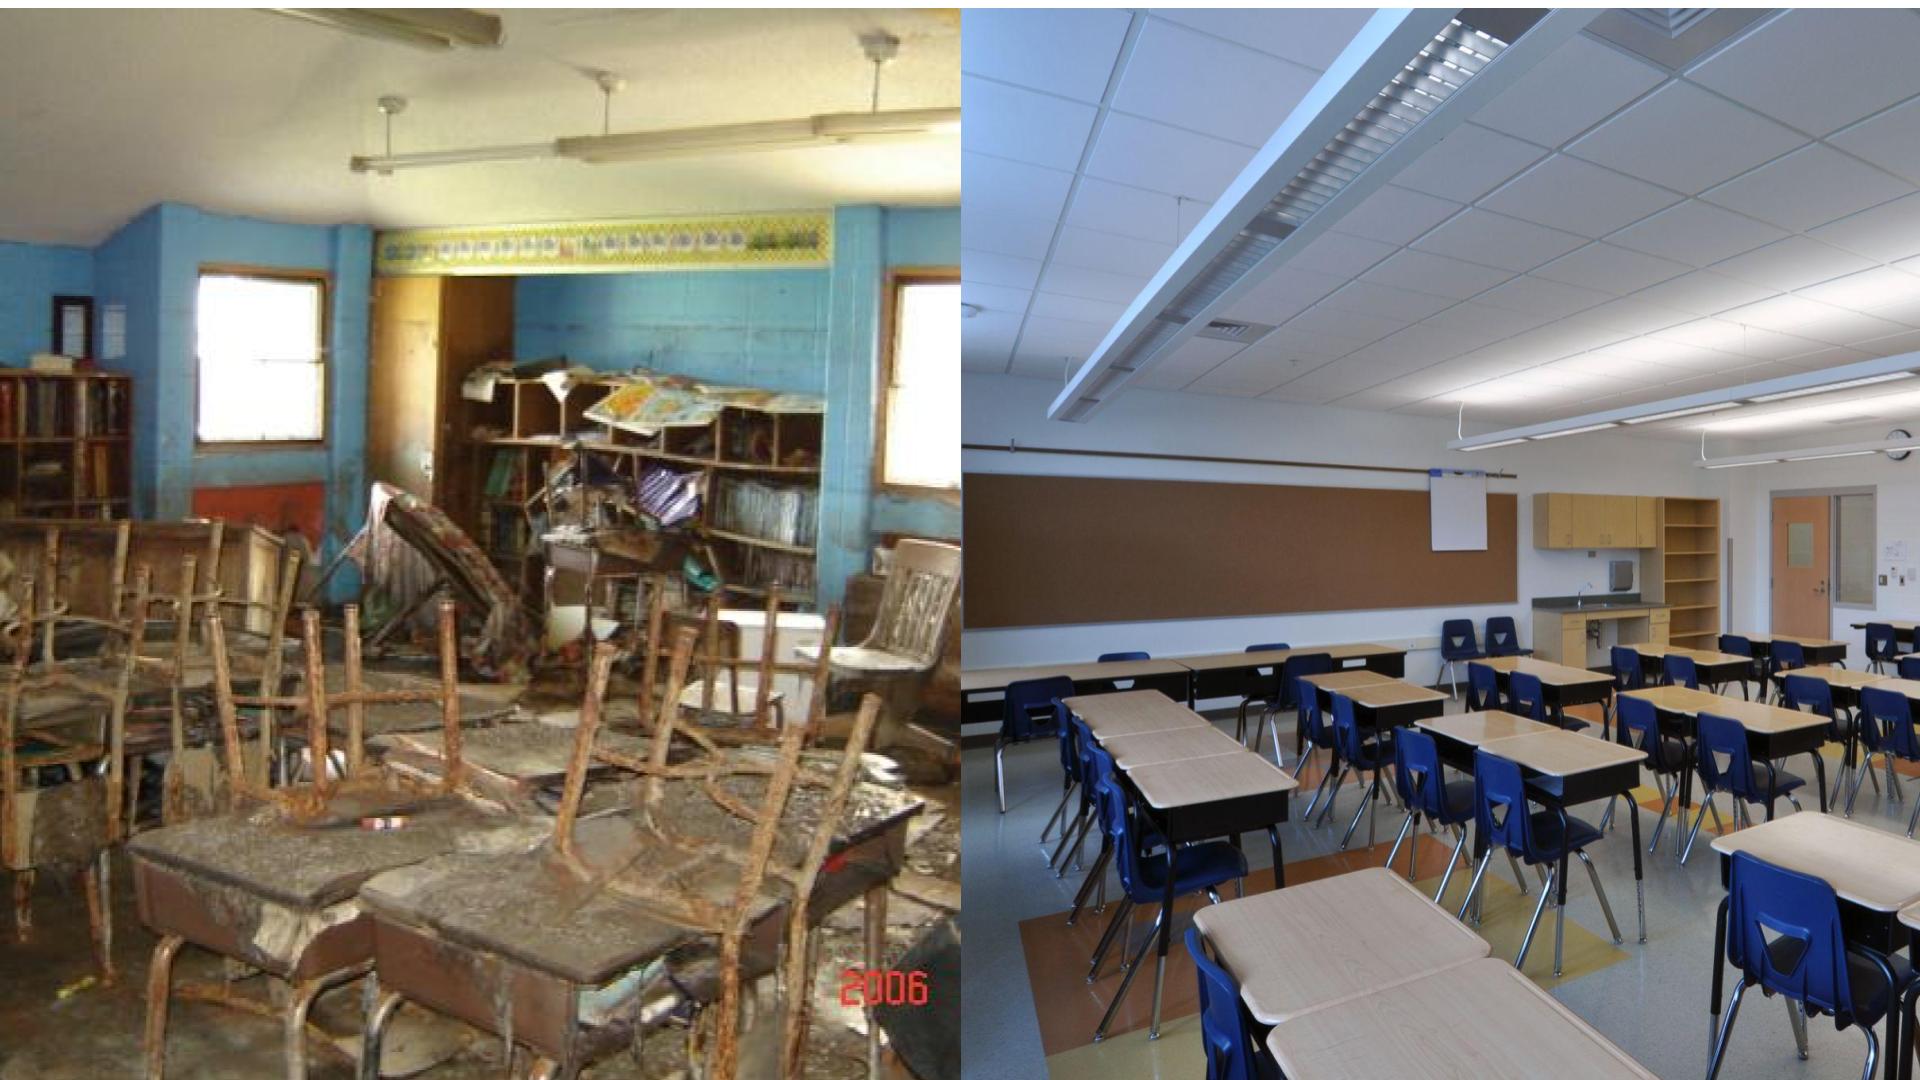
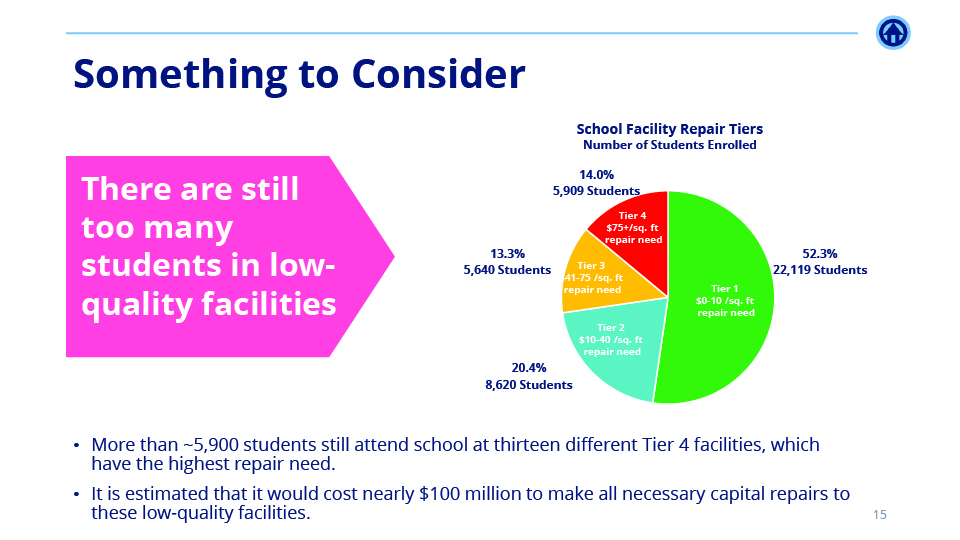
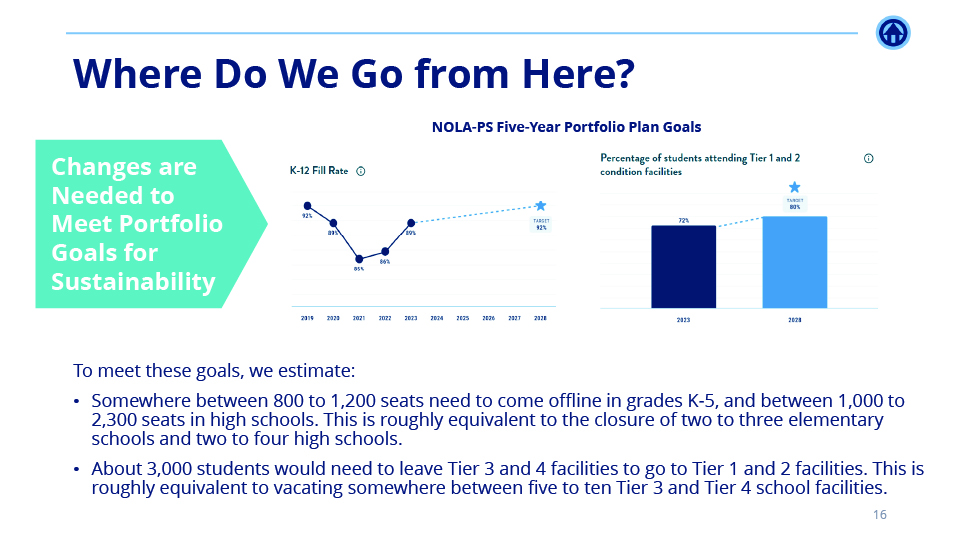
- Inadequate Facilities: New Orleans public school facilities are old and many students attend class in portable buildings, with more than $300 million in estimated capital needs.
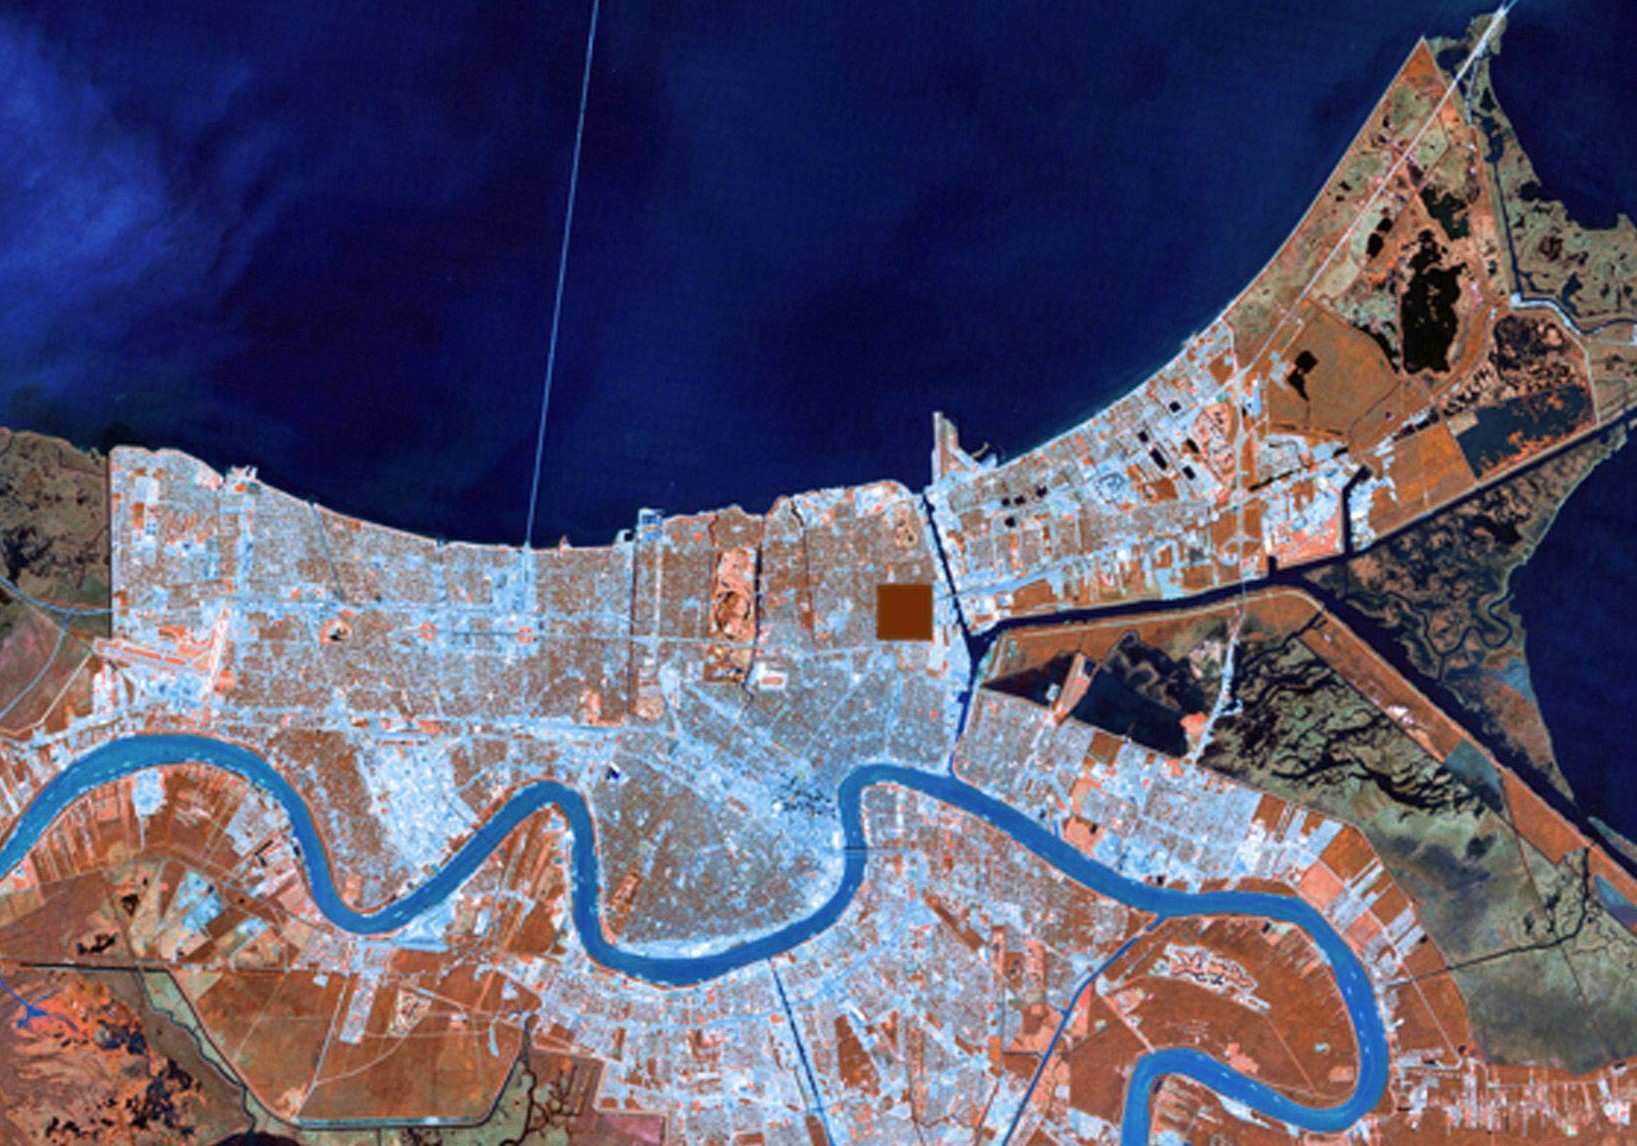
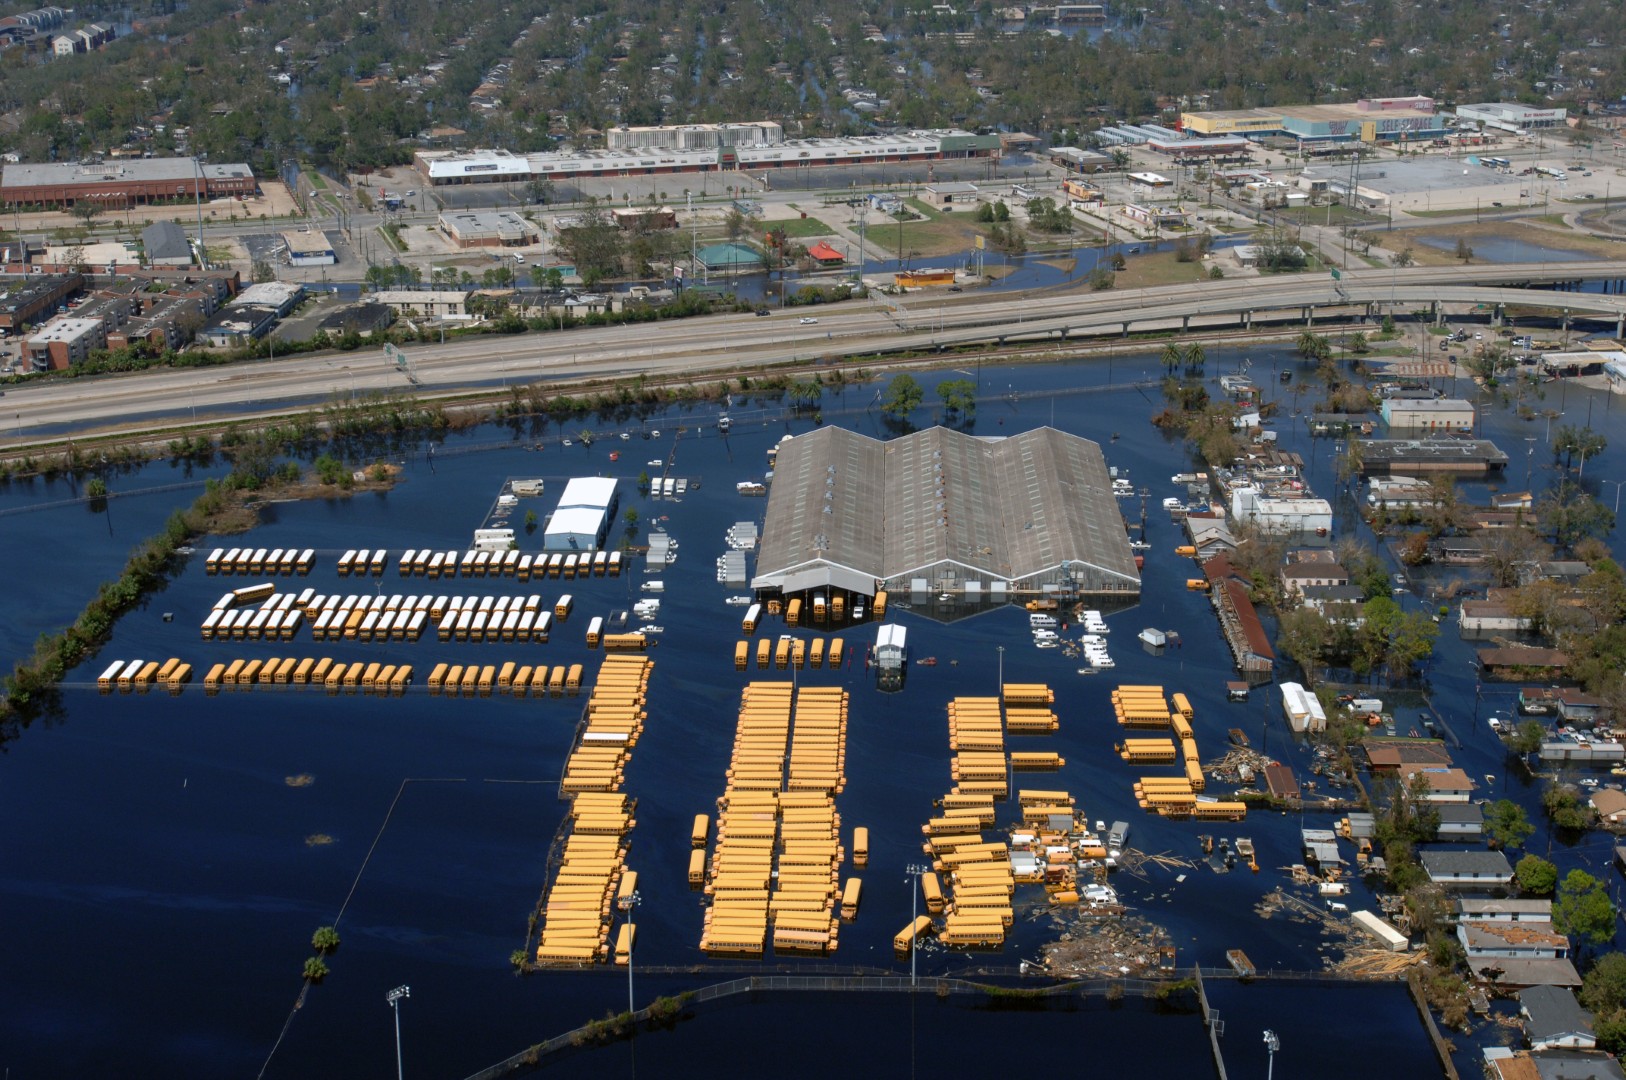
Aerial view of New Orleans before Hurricane Katrina (Source: Alamy; Credit: Jessica Wilson/NASA)
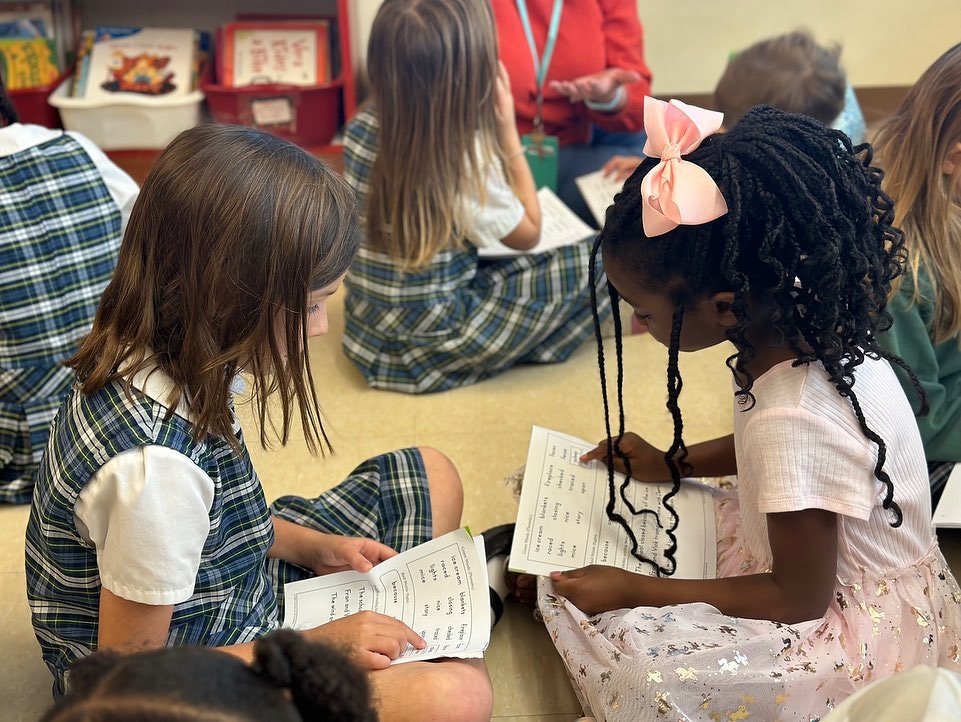
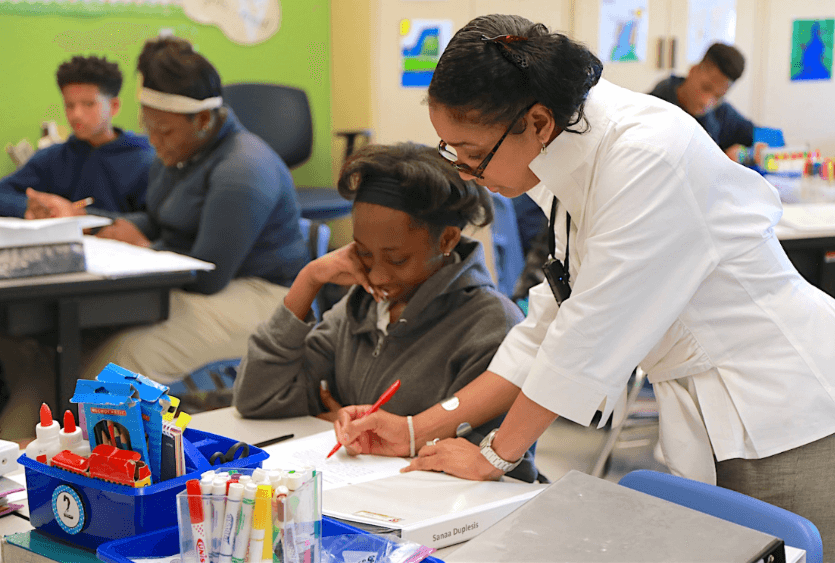
Despite the district’s challenges, there are many dedicated, experienced educators in New Orleans public schools who help create supportive school culture, vibrant alumni communities, and proud histories. These teachers include the late Lloyd Harris, Jr., who served for over 50 years as an educator in New Orleans public schools before his passing in 2021. (You can learn more about Mr. Harris here and here.)
“I love my babies. They want to learn, learn, learn.”
- Lloyd Harris, from “Longtime New Orleans band director Lloyd Harris Jr. dies at 81,” by Dominic Massa (WWL-TV), Nola.com
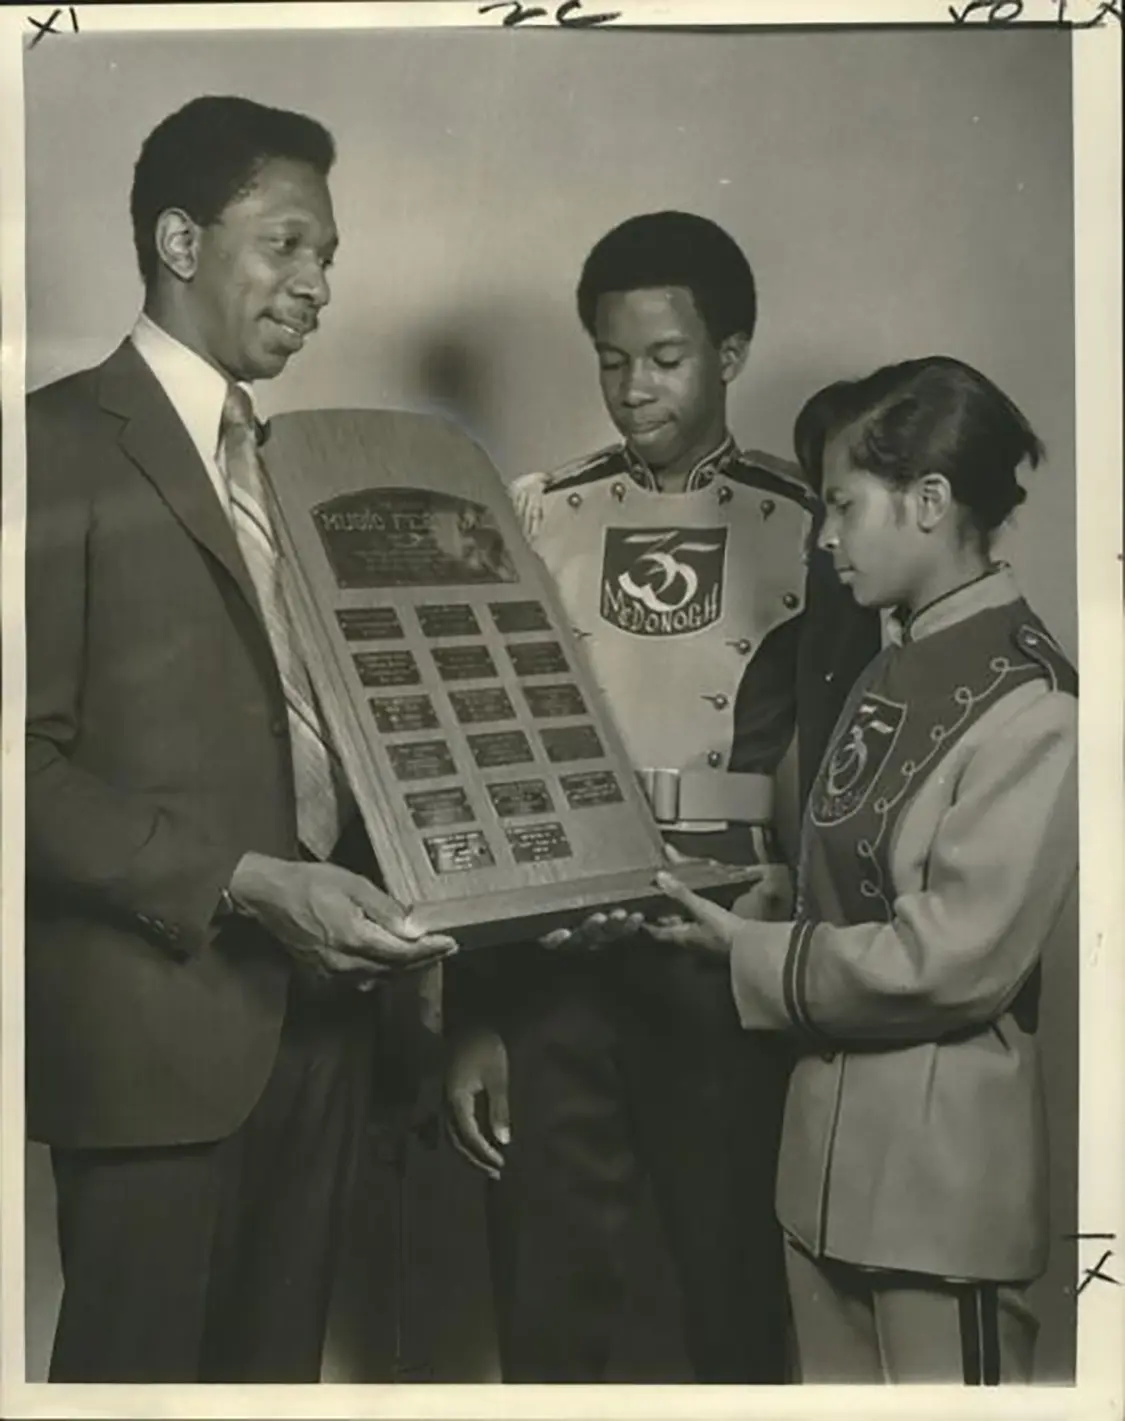
Lloyd Harris and the McDonogh35 drum major and band president (Source: NOLA.com; Credit: Pierre Hughes)